OS access advantage
T. Venturini 
S. Apartis
M. Dulong de Rosnay
Description
This indicator means to describe the very first step in most if not all impact pathways of scientific production. This first step corresponds, of course, to the access of scientific publication and other resources generated by scientific activities, that is to say the fact that these resources are accessed by users on the websites and portals that make them publicly available.
While this step is obviously crucial, little research has been carried out on it, since scholars have preferred to focus on studying how scientific resources are cited in academic and gray literature. Focusing on citations or other forms of references has the advantage of relying on a solid proxy of the fact that scientific resources have been taken up and used by some actors, yet it has the disadvantage to ignore other weaker signals of the potential usages and thus impact of science within society. Societal actors may indeed consult, read and use OS publications, datasets and software without explicitly citing them. This can happen either because the rules for referencing vary in different social and academic sectors and are less strict in some of them, or simply because the use of scientific outputs does not lead to the production of public documents or documents at all. Even academics may use OS without citing it, being for purposes of reading for learning or teaching, or automated text mining. Of course, access does not mean that the user actually read or used the resources, but it is a necessary first step for potential impact.
In this indicator, we propose to analyse access through the study of the logs of websites and portals that make scientific production available online. Simply put, studying access via connection logs boils down to answering the question: who accesses what? As open-science public policies push for the FAIRification (findability, accessibility, interoperability, and reusability) of scientific data and the opening up of publications and of all intermediary scientific outputs, it is crucial to understand the first step in the causal chain leading from access to use and ultimately to impact. Used as an exploratory and explainatory tool, a log-based comprehensive mapping of accessing users and accessed resources paves the way for more detailed usage analyses, such as time-series studies, digital user-journey analysis, and the methods of reception sociology.
Such approaches play a crucial role in understanding how, as Cole et al. (2024) put it in their summary of the Ludwig Boltzmann Gesellschaft litterature review (Soyer 2021) on the societal impact of research : access to open scientific outputs can foster “conceptual (e.g. changes to awareness, understanding or perspective), or attitudinal or cultural (e.g. behavioural changes), … or take the form of capacity building, such as long-term impacts that manifest through knowledge, skills gain or the development of relationships between diverse stakeholders”. Being based on weaker signals than citations, log analysis thus provide a more subtle entry point to understand those subjective and complex phenomena. To develop this indicator, we therefore suggest and developed a protocol to collect and analyze data directly from the connexion logs of the portals that distribute OS online—and which have become one of the most important (if not the most important) channel through which OS makes its way from academia to society.
The indicator is meant to be used comparatively in three different ways:
- First, it is meant to examine how much different resources are accessed given their availability (see also the indicators Availability of preprint repositories; Availability of publication repositories). For instance, if a given research field is characterized by a particularly low volume of resources, even a modest access of the resources that are available might as significant (and possibly more significant) than a larger volume of consultation spread across a wider set of resources.
- Second, the indicator is meant to compare specifically the access to OS resources to the access to non-OS resources, thus serving the objectives of the PathOS project in which it was created.
- Third and last, the indicator is meant to investigate not only the overall access of a given set of scientific resources, but also to drill down to examine specific access advantage within specific disciplines, specific countries or societal sectors if revealed by their IP addresses.
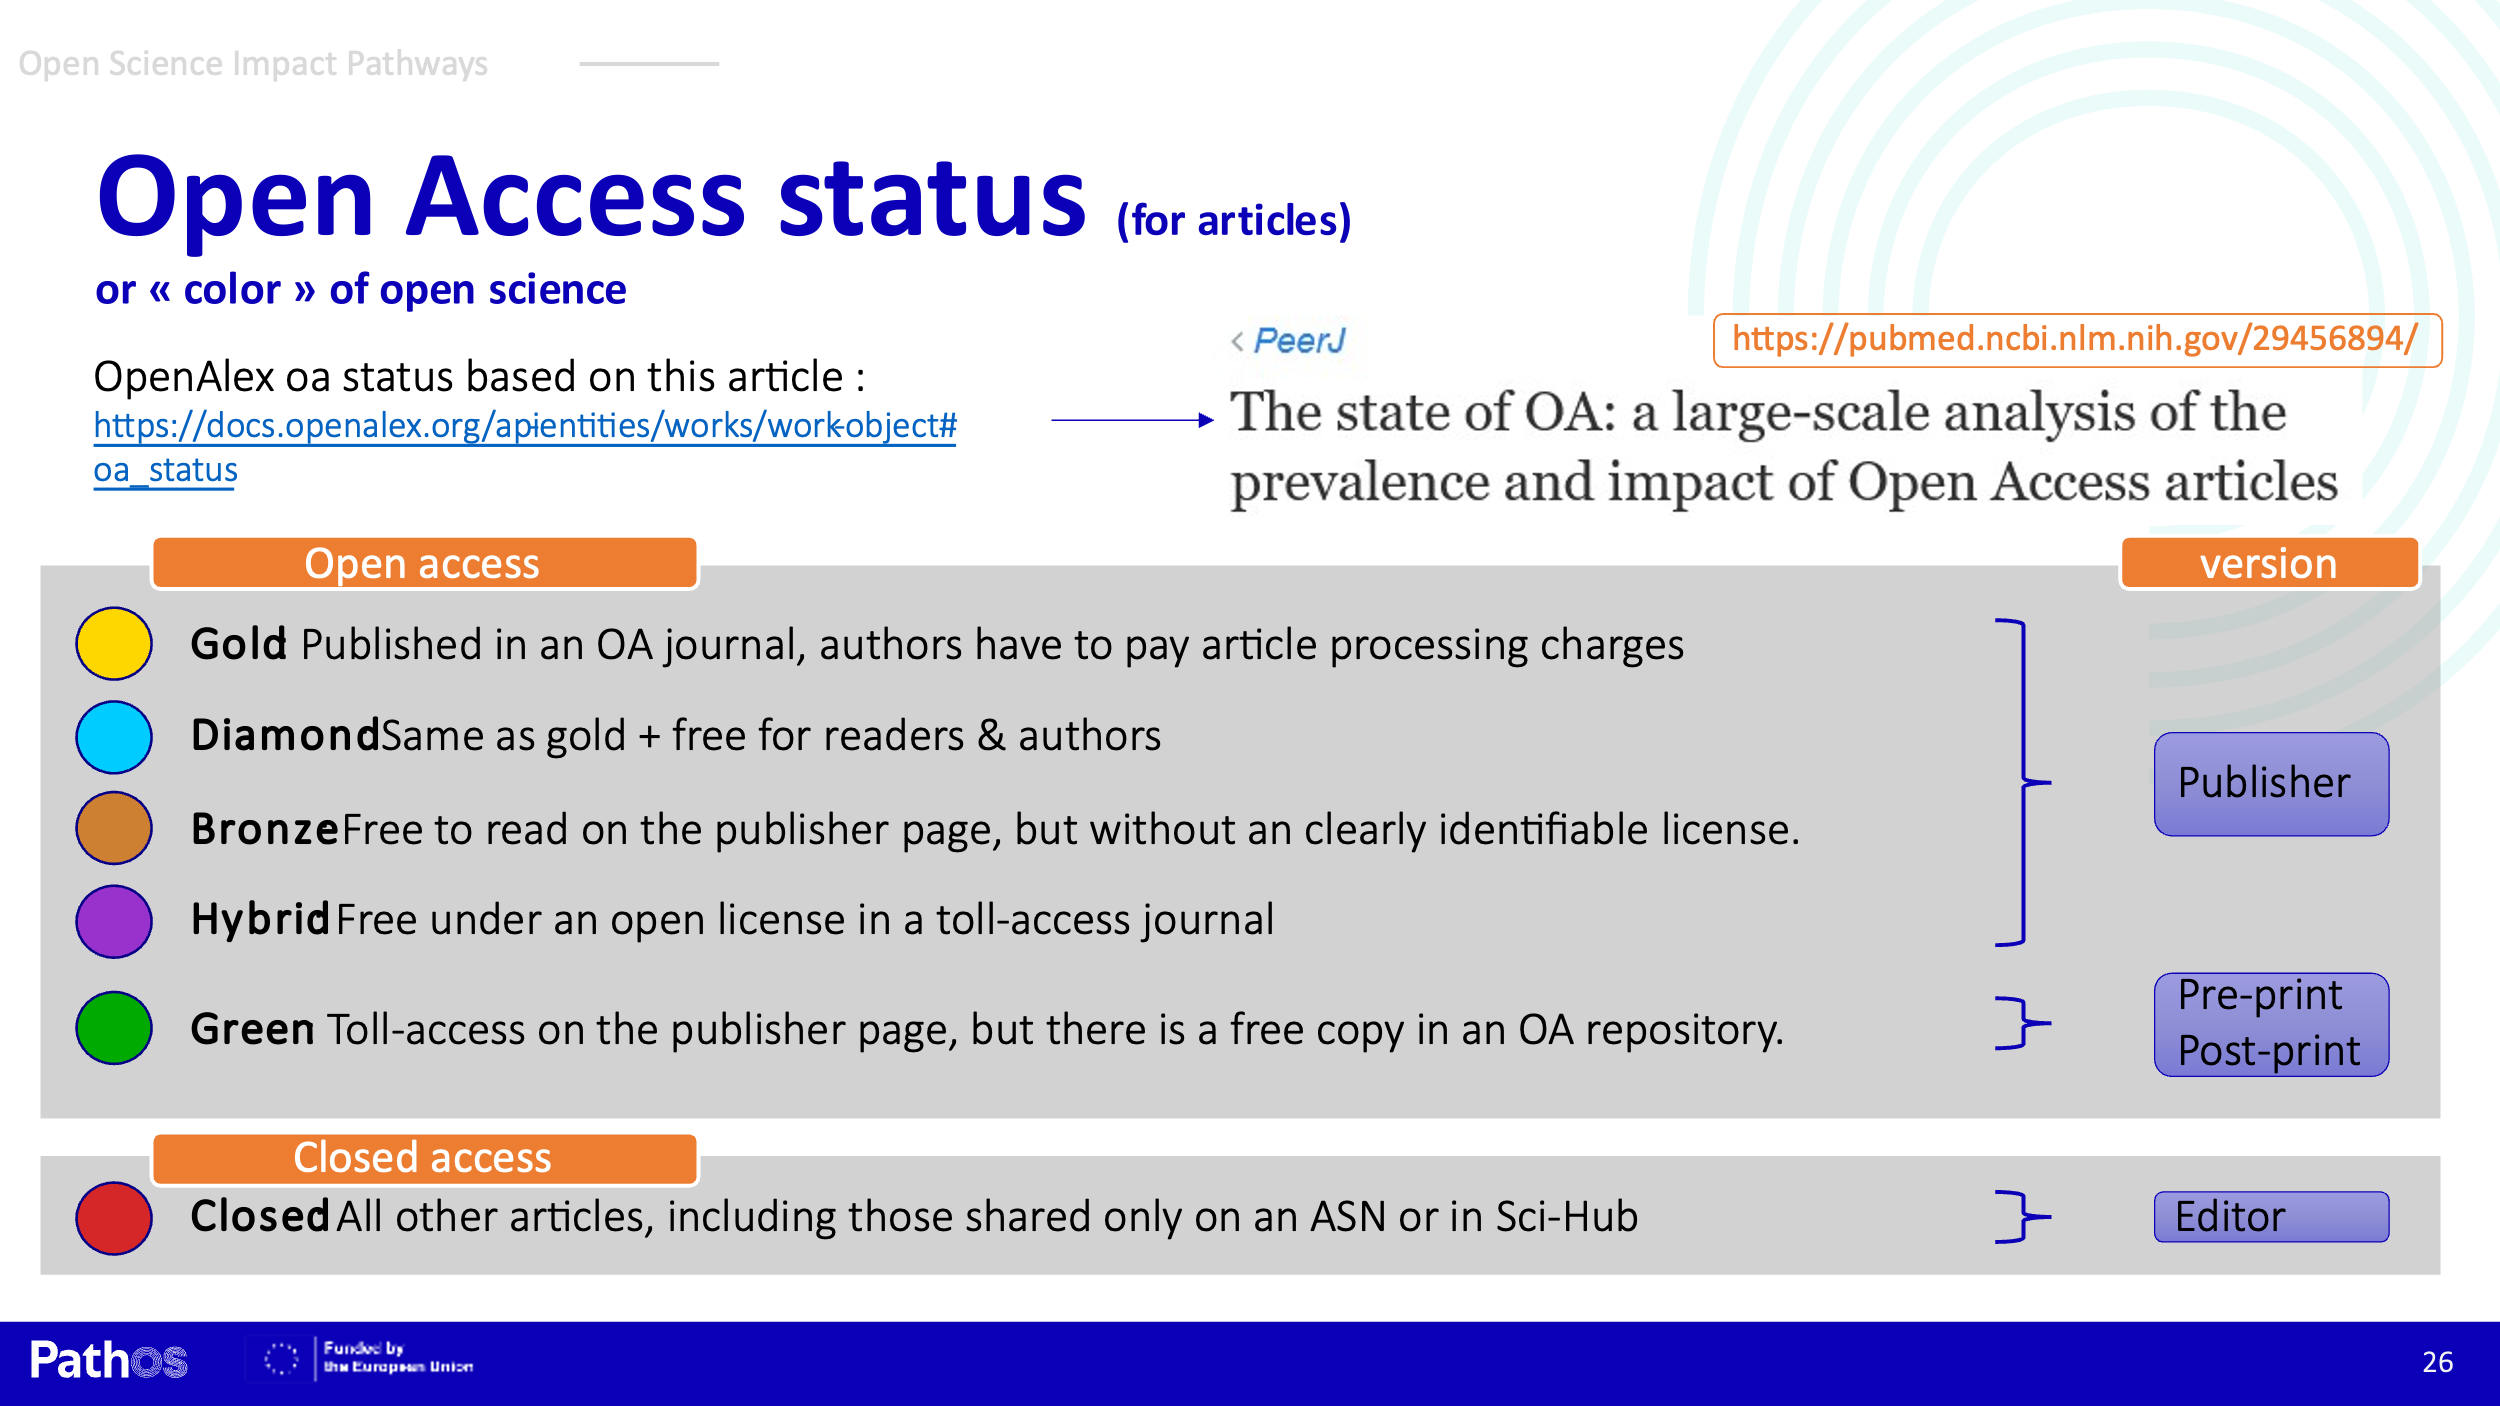
Closed access can be defined as follows (see also Prevalence of Open Access publishing):
Metrics
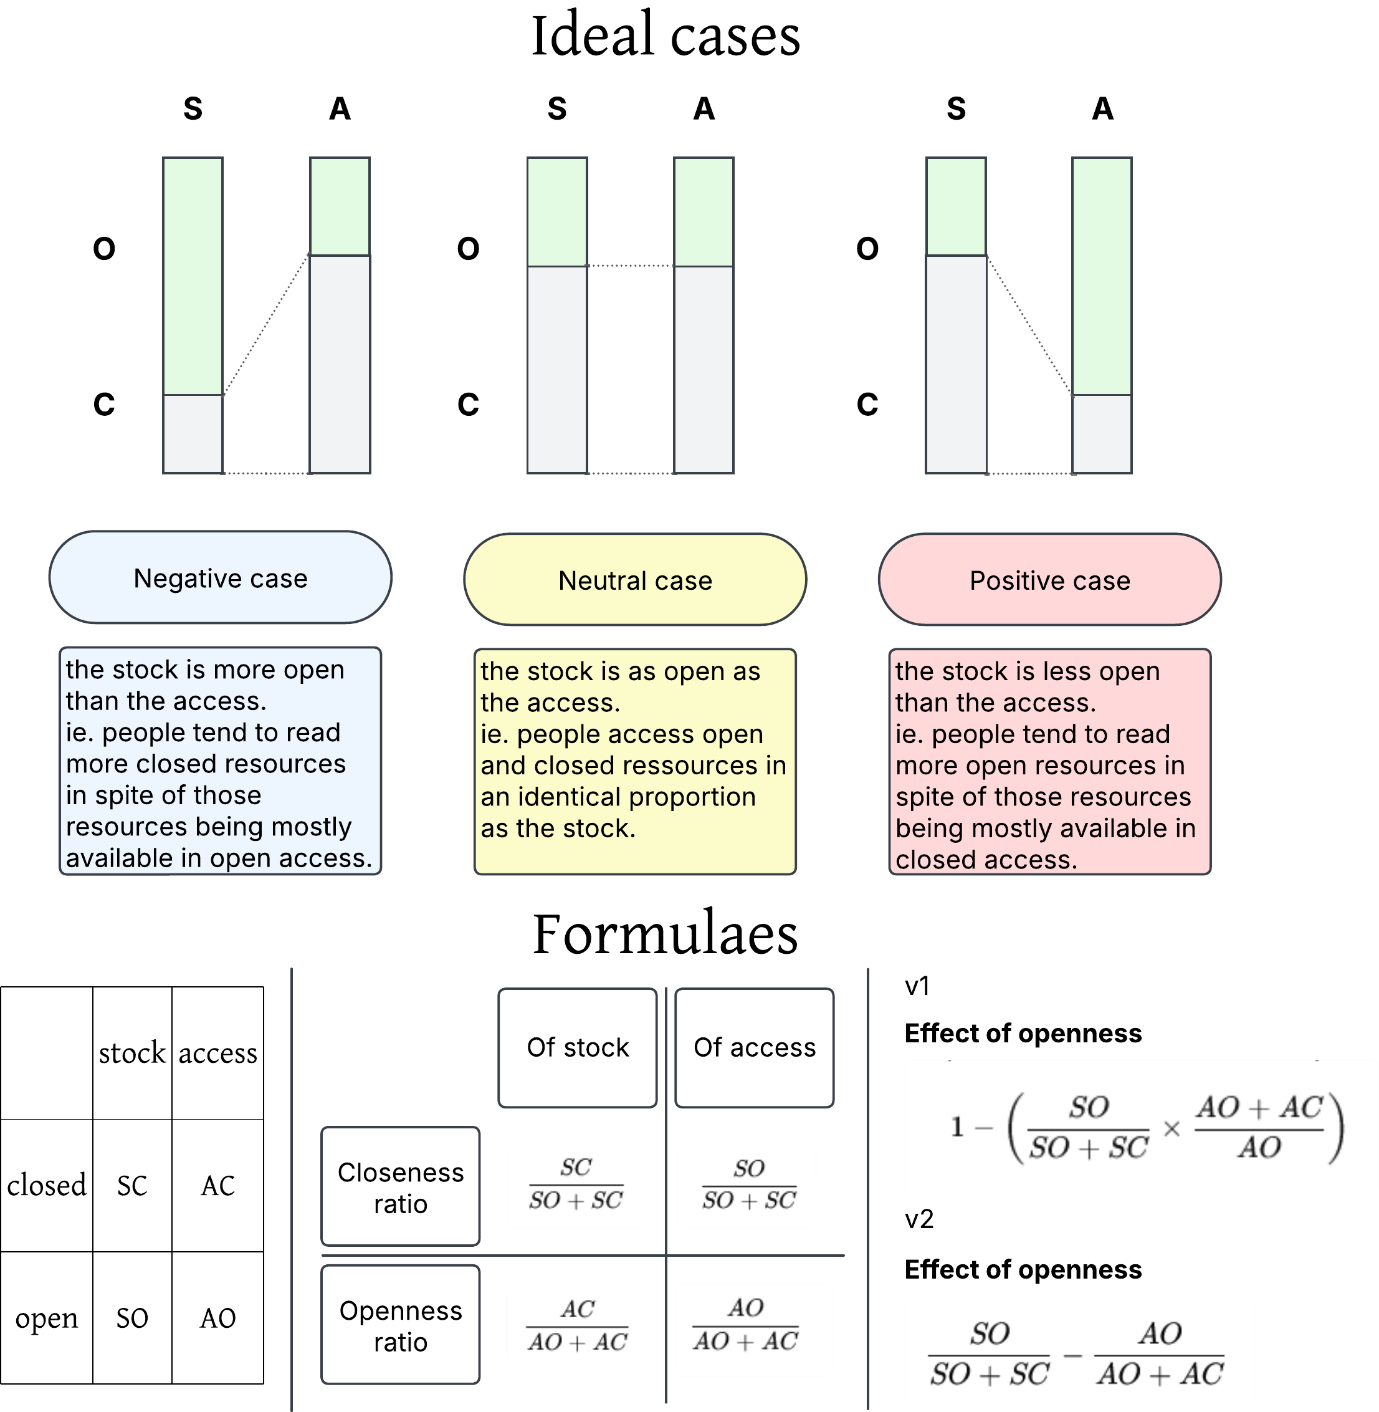
The indicator described in these pages is operationalized through a relatively straightforward metric illustrated in the image below. Simply put, the measure compares the ratio to which OS resources are accessed to the ratio of their availability. More precisely, the metric is calculated as follows :
- SO (stock open) is the unique count of available OS resources accessed at least once
- SC (stock closed) is the unique count of available non-OS resources accessed at least once
- AO (access open) is the number views collected by OS resources
- AC (access closed) is the number views collected by non-OS resources
Basically, the metrics compare the ratio of SO resources (the part of SO over the total of available resources) to the ratio of the accesses directed to SO resources (over the total of accesses).
The choice of using ratios instead of absolute values is motivated by the fact that, as explained above, this indicator is meant to be used comparatively, which entails that its values has to be somewhat normalized in order to all bring sets of scientific resources of different size to the same scale.
Since both the ratios vary between zero and one, their difference varies between one (when most of the available resources are closed and yet most of the accesses are directed to few open ones) and minus one and is minimal (when most of the available resources are open and yet most of the accesses are directed to the few close ones).
Another way of understanding the metrics is as the difference between the actual access of OS resources and the expected access that they should have if open and closed resources were equally accessed. If that case, the two ratios computed in the formula above would have the same value and the OS advantage would be null. A positive value thus means that OS is consulted more than expected given its availability (and a negative value that it is consulted less than expected).
Access advantage can also be computed for close science with the formula:
Conveniently, OS and CS access advantages are additive inverse so that if one is positive, the other will be negative of the same value (in other words their sum is always zero).
Datasources
The indicator described in these pages is meant to be computed based on access data collected by the very platforms that makes scientific resources available. Conveniently, these data are generally stored in the logs of the servers that host these platforms.
- First, logs from the servers of scientific repositories can be enriched with the meta-data associated with the resources they contain, in order to know for each accessed page whether it corresponds to an open or closed resource and in which scientific area (and potentially by which authors, institution, year of publication, etc.). At least two sources can be used for this purpose : OpenAlex (https://docs.openalex.org/), “a non-profit project that indexes and links over 250 million scholarly works from 250 thousand sources”, or the OpenAire Graph (https://graph.openaire.eu/docs/), “one of the largest open scholarly record collections worldwide, key in fostering Open Science and establishing its practices in the daily research activities”.
- Second, server logs contain information about the exact moment in which each page has been consulted (i.e., they are precisely time-stamped) and from which client IP-address (ie. a numerical label which allows to know through which gateway the resource has been accessed). The IP address and IP ranges (a set of IP addresses allocated to some organizations) does not allow to identify single users or computer (probably for the best), but it does provide information about their geographical and, in some case, institutional location (though services such as IPinfo.io, which we thank for having provided their data free of charge to the PathOS project).
As an example, one can (1) focus on the scientific domains associated with the accessed resources and (2) aggregate the IP-related information in countries and industrial sectors, for example follwiong the NACE typology (ec.europa.eu/eurostat/web/nace).
This data structure allows to observe not only the general access advantage (or disadvantage) of different type of scientific ressource, but to break the calculation down to different combination of scientific domains, countries and industrial sectors, in order to facilitate comparison and detect potential confounding factors.
References
Reuse
Citation
@online{apartis2024,
  author = {Apartis, S. and Catalano, G. and Consiglio, G. and Costas,
    R. and Delugas, E. and Dulong de Rosnay, M. and Grypari, I. and
    Karasz, I. and Klebel, Thomas and Kormann, E. and Manola, N. and
    Papageorgiou, H. and Seminaroti, E. and Stavropoulos, P. and Stoy,
    L. and Traag, V.A. and van Leeuwen, T. and Venturini, T. and
    Vignetti, S. and Waltman, L. and Willemse, T.},
  title = {Open {Science} {Impact} {Indicator} {Handbook}},
  date = {2024},
  url = {https://handbook.pathos-project.eu/sections/3_societal_impact/OS_access_advantage.html},
  doi = {10.5281/zenodo.14538442},
  langid = {en}
}